It is a type of continuous probability distribution for a real-valued random variable.
Other Names: Normal / Gaussian/ Gauss / Laplace Data Distribution
Example: Let us take a data set of some numbers
Ds= [40,10,20,25,24,40,40,14,16]
Number of points in the data set = 9
| Statistical Calculation |
Python Program |
Output |
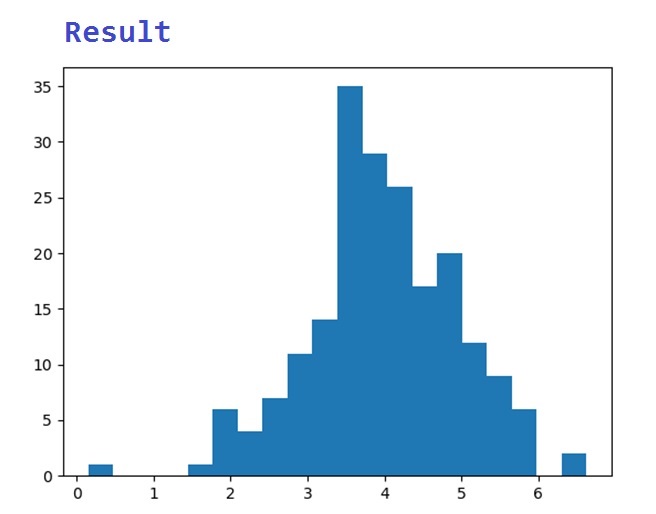
| Normal Data Distribution |
import numpy

import matplotlib.pyplot as mplobject

dd = numpy.random.normal(4.0, 1.0, 200)

mplobject.hist(dd, 20)

mplobject.show()


Explanation

mean = 4.0

Standard Deviation = 1.0
|
(array([ 1., 0., 0., 0., 1., 6., 4., 7.,
11., 14., 35., 29., 26.,17., 20., 12., 9., 6.,
0., 2.]), array([0.15032205, 0.47405083, 0.79777961, 1.1215084 , 1.44523718,1.76896596, 2.09269475,2.41642353, 2.74015231, 3.0638811 ,3.38760988,
3.71133866, 4.03506745, 4.35879623, 4.68252501,
5.0062538 , 5.32998258, 5.65371136, 5.97744015,
6.30116893,6.62489771]), <a list of 20 Patch objects>)
|
|