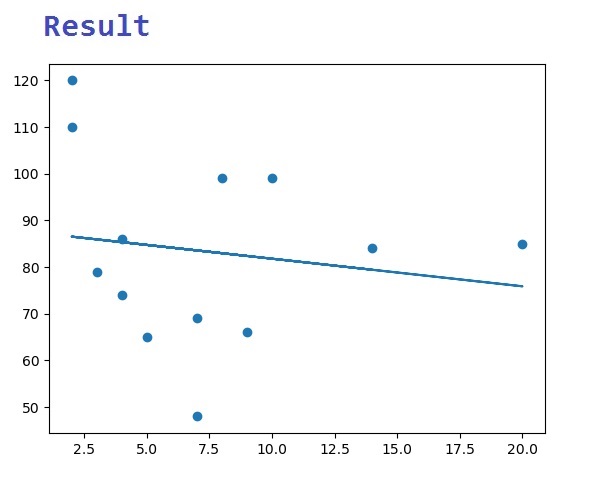
It attempts to determine the strength of the relationship between 1 dependent variable and a series of other changing variables (independent variables).
| Statistical Calculation |
Python Program |
| Regression |
import matplotlib.pyplot as mplobject

from scipy import stats


xpts = [3,5,7,9,2,20,2,8,4,14,10,7,4]

ypts = [79,65,48,66,120,85,110,99,86,84,99,69,74]


slope, intercept, r, p, std_err = stats.linregress(xpts, ypts)


def ourfunc(xpts):

  return slope * xpts + intercept


ourmodel = list(map(ourfunc, xpts))


mplobject.scatter(xpts, ypts)

mplobject.plot(xpts, ourmodel)

mplobject.show()
|
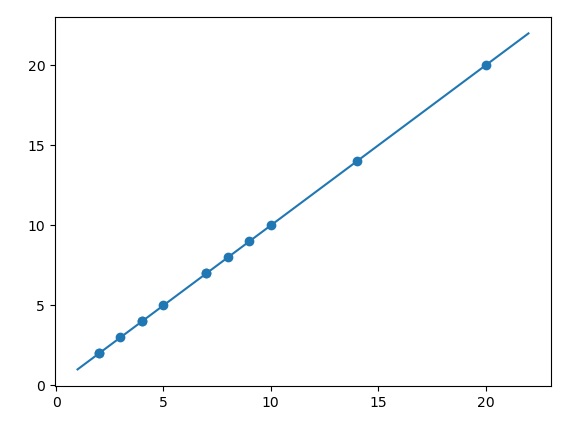
Polynomial Regression Using Numpy
It uses the relationship between the variables x and y to find the best way to draw a line through the data points.
| Statistical Calculation |
Python Program |
| Polynomial Regression |
import numpy

import matplotlib.pyplot as mplobject


xpts = [3,5,7,9,2,20,2,8,4,14,10,7,4]

ypts = [79,65,48,66,120,85,110,99,86,84,99,69,74]


ourmodel = numpy.poly1d(numpy.polyfit(xpts, xpts, 3))


ourline = numpy.linspace(1, 22, 100)


mplobject.scatter(xpts, xpts)

mplobject.plot(ourline, ourmodel(ourline))

mplobject.show()
|
Multiple Regression Using Numpy
It is used to predict a value depends on 2 / more variables. i.e. it is similar to linear regression.
Consider the below data set("products.csv").
|
Product |
price |
quantity |
profit |
category |
productconditiongood |
|
A1 |
200 |
190 |
49 |
x |
YES |
|
A2 |
400 |
560 |
45 |
x |
YES |
|
A3 |
200 |
329 |
45 |
x |
YES |
|
A4 |
100 |
265 |
40 |
x |
YES |
|
A5 |
700 |
540 |
55 |
x |
YES |
|
A6 |
200 |
329 |
55 |
x |
YES |
|
A7 |
600 |
509 |
40 |
x |
YES |
|
A8 |
700 |
765 |
42 |
x |
YES |
|
A9 |
700 |
512 |
48 |
x |
YES |
|
A10 |
800 |
550 |
49 |
x |
YES |
|
A11 |
300 |
380 |
49 |
x |
YES |
|
A12 |
500 |
390 |
51 |
x |
YES |
|
A13 |
200 |
512 |
49 |
x |
YES |
|
A14 |
800 |
652 |
44 |
x |
YES |
|
A15 |
800 |
726 |
47 |
x |
YES |
|
A16 |
800 |
730 |
47 |
y |
YES |
|
A17 |
800 |
765 |
49 |
y |
YES |
|
A18 |
1400 |
680 |
54 |
y |
YES |
|
A19 |
800 |
519 |
54 |
y |
YES |
|
A20 |
1200 |
728 |
55 |
y |
YES |
|
A21 |
800 |
984 |
44 |
y |
NO |
|
A22 |
1200 |
828 |
49 |
y |
NO |
|
A23 |
1300 |
765 |
49 |
y |
NO |
|
A24 |
800 |
815 |
49 |
y |
NO |
|
A25 |
1200 |
815 |
49 |
y |
NO |
|
A26 |
700 |
865 |
52 |
y |
NO |
|
A27 |
1200 |
890 |
54 |
y |
NO |
|
A28 |
1200 |
1125 |
64 |
y |
NO |
|
A29 |
800 |
923 |
59 |
z |
NO |
|
A30 |
1200 |
1105 |
64 |
z |
NO |
|
A31 |
1300 |
1005 |
65 |
z |
NO |
|
A32 |
1200 |
1146 |
67 |
z |
NO |
|
A33 |
800 |
635 |
54 |
z |
NO |
|
A34 |
800 |
790 |
58 |
z |
NO |
|
A35 |
800 |
805 |
59 |
z |
NO |
|
A36 |
1700 |
795 |
70 |
z |
NO |
Predict Profit of Products Based On Quantity and Price
| Statistical Calculation |
Python Program |
Output |
| Polynomial Regression |
import pandas

from sklearn import linear_model

fp = pandas.read_csv("products.csv")


Xpoints = fp[['price', 'quantity']]

ypoints = fp['profit']


regr = linear_model.LinearRegression()

regr.fit(Xpoints, ypoints)


#predict profit of a products where price=2300 and quantity = 1200

predictprofit = regr.predict([[300, 1200]])


print(predictprofit)
|
[51.87220766] |
|